The last day for all COVID-related data updates will be Thursday, April 27, 2023. The case data will be replaced with the CDC’s COVID-19 Community Level Data and the vaccine data will be replaced by the CDC’s vaccination by county.
- Click here for the CDC’s COVID-19 County Check to find community levels and prevention steps by county. Data is updated weekly by CDC.
- Click here to see the Maryland Department of Health’s COVID-19 data.
- Click here to see CDC’s data for vaccinations by county.
- Click here for more information on data sources.
COVID-19 Community Levels are a new tool to help communities decide what prevention steps to take based on the latest data. Levels can be low, medium, or high and are determined by looking at hospital beds being used, hospital admissions, and the total number of new COVID-19 cases in an area. Take precautions to protect yourself and others from COVID-19 based on the COVID-19 Community Level in your area. According to the CDC, in Harford County, Maryland, the community level is LOW. If you are at high risk for severe illness, talk to your healthcare provider about whether you need to wear a mask and take other precautions. Stay up to date with COVID-19 vaccines. Get tested if you have symptoms. People may choose to mask at any time. People with symptoms, a positive test, or exposure to someone with COVID-19 should wear a mask. If you are immunocompromised, learn more about how to protect yourself.
Case data for April 27, 2023:
Total Number of Cases: 50,654 (+26 from 4/26/2023)
Confirmed Deaths: 676 (+0 from 4/26/2023)
Positivity Percent: 3.44% (-1.64% from 4/26/2023)
7-Day Moving Avg. Case Rate per 100K: 2.68 (-1.51 from 4/26/2023)
Data can still be found at https://coronavirus.maryland.gov/. Case data is reported Monday-Friday on business days.

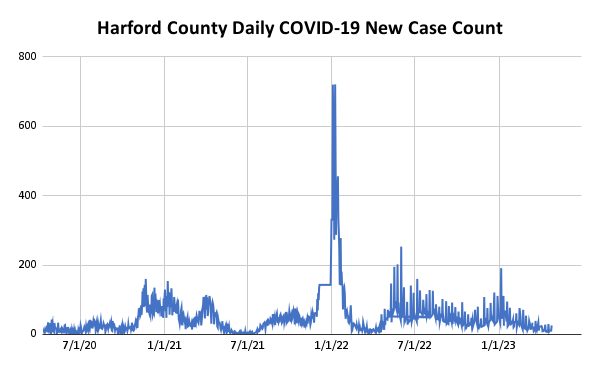
About this graph: The number of new cases in Harford County was unavailable from December 4-December 28, 2021. Between those dates, there was a total of 3,581 new cases which averaged to 143 new cases a day as reflected on the graph. On December 29, 2021, data became available again.
Deaths by Age (does not include probable deaths):
| Age | % Deaths |
| Under 65 | 21% |
| 65+ | 79% |
_____________________________________________________________________________________________


